
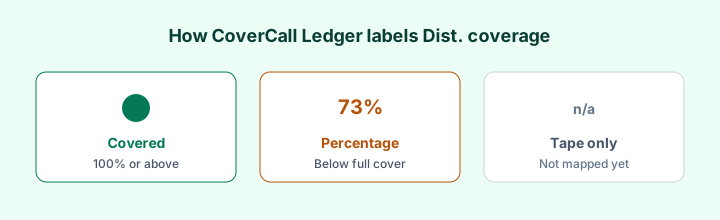
If you are looking at a 0DTE income ETF — XDTE, QDTE, RDTE, QQQY, IWMY and the rest of that wave — the question underneath the headline distribution rate is whether the fund actually earned what it paid out. This page answers the narrow, checkable version: across every daily- or weekly-writing option-income ETF that CoverCall Ledger has mapped to a 2025 issuer filing, how did period profit compare with distributions paid?
That is Dist. coverage — accrual earned versus paid, read out of annual financial statements. It is not a yield ranking, not a total-return verdict, and not a view on whether any of these funds belong in a portfolio.
Nine mapped funds, none Covered
CoverCall Ledger maps a 2025 filing for nine ETFs whose option programme runs daily or weekly rather than monthly. Not one of them read Covered.
For scale: 141 of the 311 mapped funds on the site cleared 100% for their filing year, about 45%. Narrow it to US-listed funds, where all nine of these are listed, and 31 of 140 mapped funds read Covered — roughly 22%. Nine misses out of nine is a long way from either base rate.
| Fund | Index | Filing period | Earned | Distributed | Dist. coverage |
|---|---|---|---|---|---|
| QDTY | Nasdaq-100 | 2025 stub | $600 thousand | $939 thousand | 64% |
| SDTY | S&P 500 | 2025 stub | $782 thousand | $1.4 million | 54% |
| QDTE | Nasdaq-100 | 2025 | $157.3 million | $372.1 million | 42% |
| XDTE | S&P 500 | 2025 | $44.7 million | $136.4 million | 33% |
| WDTE | S&P 500 | 2025 FY Aug | $6.6 million | $32.2 million | 21% |
| QQQY | Nasdaq-100 | 2025 FY Aug | $14.6 million | $91.3 million | 16% |
| RDTY | Russell 2000 | 2025 stub | $95 thousand | $592 thousand | 16% |
| RDTE | Russell 2000 | 2025 | $9.8 million | $66.6 million | 15% |
| IWMY | Russell 2000 | 2025 FY Aug | $10.8 million | $76.1 million | 14% |
Added up — and the fiscal windows differ, so treat this as a sense of scale rather than a single-period figure — those nine funds recorded roughly $245 million of filing-period profit against roughly $778 million distributed. Close to 32 cents of filed profit for every dollar paid out.
Same index, slower writing, better coverage
The base rate on its own is not that interesting, because these funds all launched into the same stretch of market. The sharper test is to hold the underlying index constant and vary only how often the fund writes calls.
CoverCall maps monthly writers alongside daily writers on all three indexes the 0DTE products use. In every one of the three families, every monthly fund read higher than every daily or weekly fund on the same index.
| Index | Monthly writers | Daily / weekly writers |
|---|---|---|
| Nasdaq-100 | QQCC Covered (CA, 2025) · QYLD 73% (FY Oct) | QDTY 64% (stub) · QDTE 42% · QQQY 16% (FY Aug) |
| S&P 500 | USCC Covered (CA, 2025) · XYLD 76% (FY Oct) · XYLG 59% (FY Oct) | SDTY 54% (stub) · XDTE 33% · WDTE 21% (FY Aug) |
| Russell 2000 | RSCC 83% (CA, 2025) · RYLD 61% (FY Oct) · RYLG 51% (FY Oct) | RDTY 16% (stub) · RDTE 15% · IWMY 14% (FY Aug) |
Three index families, three times the same ordering. That is a pattern worth noticing, though the periods do not line up cleanly and nine funds is a small sample — the caveats section below spells out why this is directional rather than a controlled experiment.
Why writing more often is not the same as earning more
Selling an option every session does collect more gross premium over a year than selling one a month. Premium does not scale with time in a straight line, so twelve monthly options are worth far less than roughly 250 daily ones.
The catch is that each of those daily calls also caps that day's upside. A monthly writer sells one strike and keeps whatever the index does below it for four weeks, including the run-ups that happen inside the month. A daily writer resets the cap every morning, so an index that grinds higher in a series of modest daily gains hands most of that appreciation back as realised losses on the short calls.
Accrual coverage is sensitive to exactly that, because it counts period profit including unrealised gains on what the fund still owns. A fund that has sold away most of its participation has less of that cushion to show against the cheque.
Distribution policy matters at least as much, and the dollars make the point better than the mechanics do. QDTE distributed $372.1 million against $157.3 million of filing-period profit. QYLD, a far larger fund, distributed $1.07 billion against $780.0 million. Both paid more than they earned on this lens, but the 0DTE fund's payout was set at a much higher multiple of what its strategy produced. These are candidate explanations drawn from how the strategies are described, not a causal finding — the filings show the gap, not the reason for it.
Return of capital is a related but separate question
Much of the 2026 commentary on this group is about return of capital rather than coverage. Roundhill's Rule 19a-1 notice for the June 2026 distributions on XDTE, QDTE and RDTE estimated 100% of each payment as return of capital, and the issuer notes these are preliminary estimates that will be finalised on 2027 tax forms. Several other issuers in this category carry similar language in their prospectuses.
A 19a-1 estimate is a tax-character statement about a single distribution. Dist. coverage is an economic statement about a completed filing year. They can disagree in both directions, which is why the return of capital vs earned the cheque note keeps them apart — and why the NEOS lineup, which also draws ROC headlines, still shows mapped funds clearing 100%.
Read the period labels before reading the ranking
These nine funds are not mapped to the same window. Three sit in calendar 2025, three in a financial year ending in August, and the three YieldMax funds are labelled `2025 stub`, meaning a partial first year rather than twelve months.
A stub is internally consistent — earned and paid cover the same window — but it is not comparable to a full year and is not an annualised run rate. The three stub funds are also small, with tape AUM under $15 million each, so their percentages rest on very small dollar bases.
A weak coverage year is not a bad year
This is the part the headline number does not capture. On the exchange tape, the same funds have had a reasonable 2026 so far.
As of the site's latest price date, cash 2026 YTD reads +13.8% for QDTE against +13.1% for QYLD, +15.4% for RDTE against +11.1% for RYLD, and +10.5% for XDTE against +9.8% for XYLD. Those are tape figures — price change plus cash distributions, not reinvested — for a different period from the filings, and they are not Dist. coverage.
So the honest summary is narrow: in their mapped 2025 filing years, these funds paid out considerably more than their statements recorded as period profit. That is a real fact about those years. It is not a prediction, and as the yield versus coverage guide argues, it is not a substitute for looking at total return.
The ones without a filing yet
Several daily-income funds are too new to map, including ODTE, NYYY, TYYY and TMGN, all of which launched during 2026.
Those pages are tape-only. Price, last distribution and AUM come from the exchange, and the Dist. coverage column stays empty rather than being inferred from a distribution rate. That distinction is the whole point of the how to read Dist. coverage walkthrough.
How to check one yourself
- Open the ticker in the fund directory and read the earned and distributed dollars, not just the percentage.
- Check the filing period label first. A stub year and a full year are not comparable.
- Compare against a monthly-writing fund on the same index rather than against a different asset class.
- Read the issuer's 19a-1 notices for tax character, and treat that as a separate question from coverage.
- Confirm anything here against the live coverage table, because filings and tape both move.
Educational research from public issuer filings. Not investment, tax or trading advice — confirm every figure against the issuer's own documents before acting on it.