
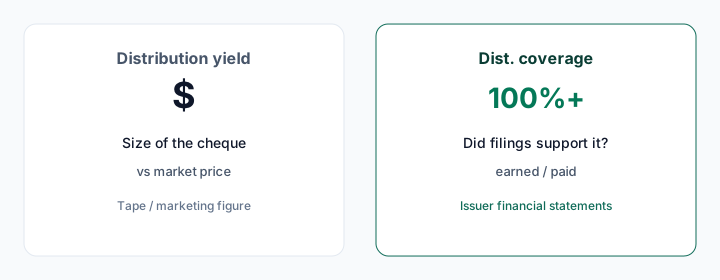
Income ETF research usually starts with distribution yield — a rate based on recent payments and price. CoverCall Ledger focuses on a second question: did issuer financial statements support what was paid? Mixing the two measures is how “high yield” gets confused with “earned the cheque.”
Side-by-side
| Measure | What it tells you | Typical source | Moves when… |
|---|---|---|---|
| Distribution yield | Size of recent payments vs price | Market tape / issuer distribution page | Price changes or the last cheque changes |
| Dist. coverage | Whether period profit supported distributions for a filing year | MRFP / annual FS / N-CSR | A new statement year is mapped |
High yield with weak coverage is a different risk picture than high yield with full coverage.
Yield is a rate, not a quality score
Yield does not tell you whether last year’s accounting earnings supported the cheques. For covered-call and option-income funds, premiums can make distributions look large even when underlying holdings barely advanced — or while unit price drifted lower.
Coverage uses accrual earnings
Dist. coverage compares earned (period profit, including unrealized gains where reported) to distributed for a stated year. At 100%+ we show Covered; otherwise the percentage. Tape-only rows mean the filing year is not mapped yet — we do not invent a coverage %.
Filing-backed examples
- HHIS — High income shares branding; 2025 Dist. coverage 88% (earned $133.2M vs paid $150.9M)
- HMAX — Covered on Dist. coverage (earned $385.4M vs paid $198.1M)
- ZWB — Covered (earned $1.01B vs paid $207.6M)
- JEPI — 96% covered for FY ended Jun 30, 2025
- QYLD — 73% covered for FY ended Oct 31, 2025
Open the live table to sort by Dist. coverage alongside last distribution and 2026 YTD tape fields.
A practical order
1. Check yield / last dist on the issuer site (current income rate).
2. Check Dist. coverage for the completed filing year on CoverCall Ledger.
3. Confirm both against the issuer’s MRFP or N-CSR.
Deeper walkthrough: How to read Dist. coverage. Basics: What is distribution coverage?.