Start here
How to read Dist. coverage on CoverCall Ledger
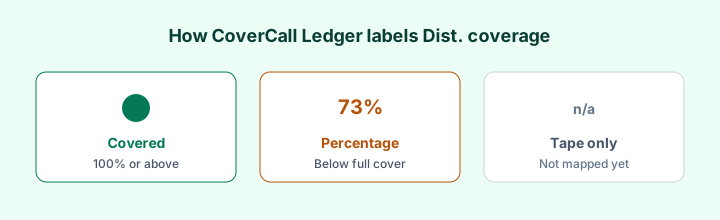
Walkthrough of Covered vs percentage vs tape-only labels, preview unlock, and which table columns are not Dist. coverage.
Learn · Canada + US
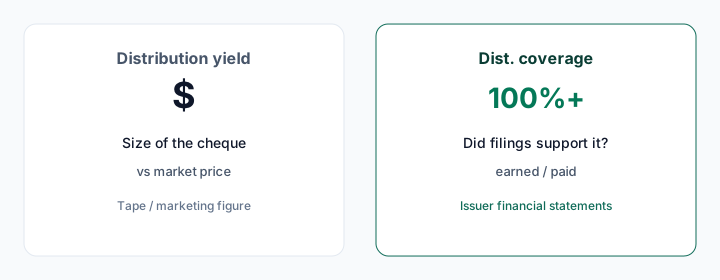
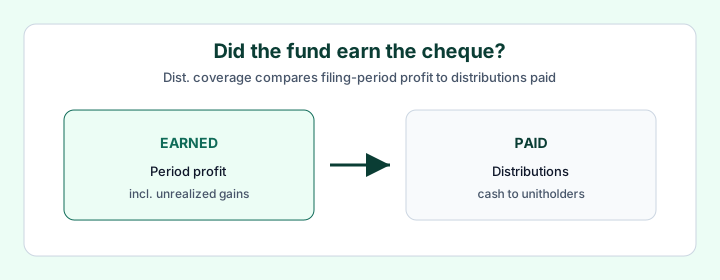
Yield tells you the size of the cheque. Dist. coverage asks whether issuer financial statements supported what was paid — for Canadian and US-listed covered-call and option-income ETFs.
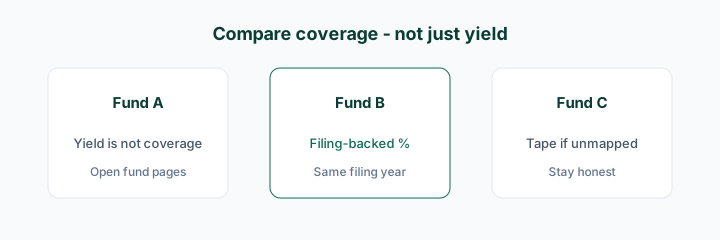
Read one of these, then open the coverage table or a fund page. Flagship comparisons: HMAX vs ZWB vs HDIV and JEPI vs JEPQ vs QYLD.
Start here
Walkthrough of Covered vs percentage vs tape-only labels, preview unlock, and which table columns are not Dist. coverage.
Start here
Dist. coverage asks whether issuer filings supported ETF distributions for a stated year — earned vs paid, not yield. Mapped examples: HHIS, HMAX, ZWB, JEPI.
Start here
Yield is the size of the cheque vs price. Dist. coverage asks whether issuer filings supported it. Why high yield and weak coverage can coexist.
Basics
Dist. coverage asks whether issuer filings supported ETF distributions for a stated year — earned vs paid, not yield. Mapped examples: HHIS, HMAX, ZWB, JEPI.
Basics
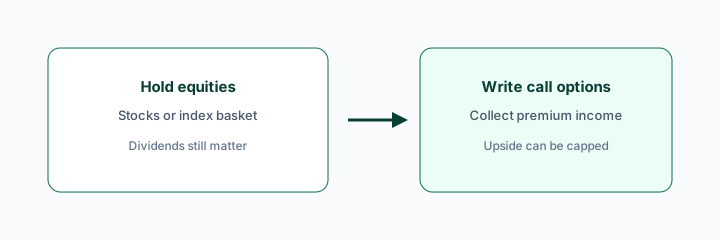
Plain-language guide to covered-call and buy-write ETFs in Canada and the US — how they work, trade-offs, and examples like HMAX, ZWB, QQCL, JEPI, and QYLD.
Basics
Yield is the size of the cheque vs price. Dist. coverage asks whether issuer filings supported it. Why high yield and weak coverage can coexist.
Basics
Walkthrough of Covered vs percentage vs tape-only labels, preview unlock, and which table columns are not Dist. coverage.
Basics
Educational checklist for finding earned vs paid in Canadian MRFPs and US N-CSR reports — the same lens CoverCall Ledger maps.
Comparisons
Compare Hamilton HMAX, BMO ZWB, and Hamilton HDIV — strategy focus and mapped 2025 Dist. coverage (all Covered on the accrual lens, with different mandates).
Comparisons
Compare JEPI, JEPQ, and QYLD on mapped Dist. coverage — 96%, 88%, and 73% for their respective fiscal periods — not a yield leaderboard.
Comparisons
QQCL (Canada, enhanced Nasdaq-100 covered call) vs QYLD (US Nasdaq-100 covered call) — listings, overlays, and mapped Dist. coverage.
Issuers
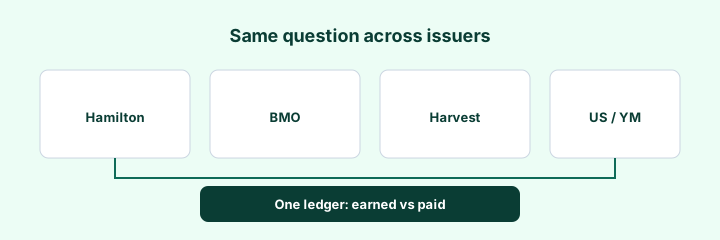
How three major Canadian issuers run covered-call and income ETF lineups — product philosophy, representative funds, and mapped Dist. coverage links.
Issuers
Mapped 2025 filings for 16 NEOS ETFs: 10 covered distributions, median 100%. What SPYI, QQQI and BTCI earned vs paid — and why that isn't the ROC question.
Issuers
Mapped 2025 filings for Global X CA vs US twins: QQCC/QYLD, USCC/XYLD, RSCC/RYLD. Dist. coverage from statements — not yield.
Insights
ROC is a tax label for distributions. Dist. coverage is accrual earned vs paid from filings. They sound related but answer different questions — not tax advice.
Insights
What single-stock option-income ETFs are, and what mapped 2025 filings show: 3 of 34 YieldMax funds covered distributions, median near 46%.
Insights
Mapped 2025 filings for 94 Canadian option-income ETFs: two-thirds covered distributions, while bond overlays and crypto-linked funds fell short.
Insights
Fifteen Canadian ETF pairs where the only difference is about 25% leverage. What mapped 2025 filings show for enhanced vs standard Dist. coverage.
Insights
Mapped 2025 filings for 10 bitcoin overlay ETFs: none Covered. Dist. coverage from statements — not yield or ROC estimates.
Insights
Nine mapped 0DTE and weekly-writing ETFs, none Covered for 2025. What filings show when the same index is written daily instead of monthly.
Not investment advice. Confirm figures against issuer documents.