
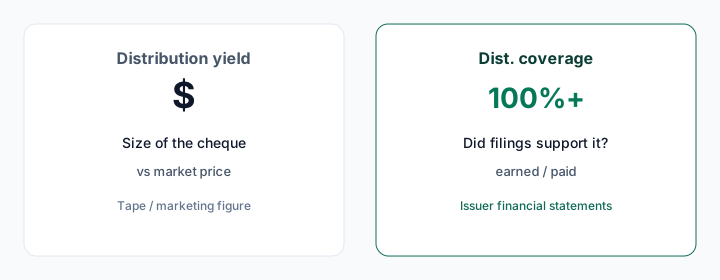
Searches for a treasury covered call ETF, or for HPYT, HBND or TLTW coverage, usually return a yield. This page answers a different question with the same tickers: for the mapped 2025 filings, did period profit cover what HPYT, HBND, TLTW and the rest of the bond-overlay shelf paid out?
That is Dist. coverage — accrual earned versus paid, read from issuer financial statements. It is not a yield ranking, not a duration call, and not a view on whether any of these funds belongs in a portfolio.
Bonds have coupons. The cheque is still the overlay
A stock covered-call still collects dividends. A bond overlay collects coupons. These products are sold on option-enhanced yield well above that coupon, so the cheque is coupon plus premium plus whatever the manager pays from capital.
If marks, coupons and the overlay produced enough period profit, coverage can still print Covered. If they did not, the table shows a percentage. Duration explains why the marks moved. It does not replace the filing math.
The late-October 2026 conversation is about distribution cuts, not earned versus paid. Harvest's 23 October 2026 announcement kept HPYT at $0.06 — after the issuer's table stepped the monthly cheque from $0.15 (into May 2025) to $0.13, $0.11, $0.09, then $0.06 from July 2026. Hamilton posted October figures for HBND and HBIL the same day. Those are policy notices. They are not Dist. coverage.
Harvest's commentary on HPYT says option premiums fell with implied volatility, and that the fund writes on only part of the book so some duration upside remains. That is structure. Dist. coverage is whether filing-period profit covered cash paid for a stated year.
Four Canadian overlays, same calendar 2025, none Covered
All four Canada-listed bond overlays mapped here share calendar 2025, so the percentages are comparable in a way mixed fiscal years are not.
| Ticker | Issuer | Mandate, in one line | Dist. coverage | Earned vs paid |
|---|---|---|---|---|
| HPYT | Harvest | Long-dated US Treasuries via ETFs, covered calls | 20% | $19.8 million vs $98.8 million |
| HBND | Hamilton | Long US Treasuries via ETFs, Yield Maximizer overlay | 33% | $7.1 million vs $21.6 million |
| HBIL | Hamilton | Mostly US T-bills plus a long-Treasury sleeve | 35% | $4.9 million vs $13.9 million |
| PAYS | Global X | Short-term Canadian government bonds, dynamic options | 44% | $2.2 million vs $5.1 million |
Zero of four cleared 100%. Across the mapped universe, 162 of 343 funds read Covered for their 2025 filing year; among Canadian-listed mapped funds the rate is 111 of 172.
HPYT is the scale name — Harvest markets it as Canada's largest covered-call bond ETF. Mapped statements recorded $19.8 million earned against $98.8 million paid, about five times period profit. Issuer holdings as at 30 September 2026 were concentrated in long US Treasury ETFs (TLT 83.9%), with modified duration 14.8. Harvest says the fund may write on up to 100% of the book.
HBND is the Hamilton analogue: no leverage, CAD-hedged, TLT / VGLT / EDV, duration 15.4, mapped 33%. Hamilton's "coverage ratio" is the share of the bond book it writes calls on. It is not Dist. coverage — see how to read Dist. coverage.
HBIL is the short-duration sibling: about 80% ultra-short T-bills and 20% TLT, duration near 3 as at the same date. It still read 35%. A T-bill sleeve can miss when the cheque is larger than period profit. Duration is not the whole story.
PAYS writes a dynamic put-and-call programme on short-term Canadian government bonds (duration generally under three years). Mapped coverage was the least-weak of the four at 44%, still a $2.9 million miss on its own statements.
Same asset, different listing: HPYT versus TLTW
HPYT and TLTW both wrap long US Treasuries, mostly TLT. They do not share a fiscal year, so the percentages are directional, not a same-day race.
| Ticker | Listing | Filing period | Dist. coverage | Earned vs paid |
|---|---|---|---|---|
| HPYT | Canada | Calendar 2025 | 20% | $19.8 million vs $98.8 million |
| TLTW | US | FY ended 31 October 2025 | 67% | $120.2 million vs $178.4 million |
On that October fiscal year TLTW tracked a Cboe TLT buy-write index — hold TLT, write calls, collect premium, cap upside above the strike. It earned $120.2 million and distributed $178.4 million, 67%: a smaller miss in percentage terms than HPYT and a much larger gap in dollars.
The issuer announced a rename to iShares TLT Premium Income+ ETF around 15 October 2026. The mapped figure is the older buy-write window, not a reading of the new rules.
Smaller US long-Treasury overlays sit on stub windows and tiny dollar bases: TLTI 45% ($0.09 million vs $0.21 million), TLTP 18% ($187 thousand vs $1.0 million), LTTI 8% ($48 thousand vs $606 thousand), TLTX Covered ($171 thousand vs $122 thousand). A few hundred thousand dollars either way moves those percentages. Read the dollars.
Cash and credit overlays were a different book
The NEOS fixed-income sleeves are all 2025 stubs. CSHI read 98% ($18.6 million vs $19.0 million). BNDI and HYBI both read Covered ($5.3 million vs $3.6 million, and $8.6 million vs $7.7 million). Those partial windows are already in the NEOS lineup note. They are not annualised, and they are not a claim that US overlays beat the Canadian ones.
The iShares credit buy-writes share TLTW's October fiscal year and also missed: HYGW 45% ($11.9 million vs $26.5 million), LQDW 48% ($17.7 million vs $36.8 million).
Put the full-year overlays in one list and the pattern is blunt. HPYT, HBND, HBIL, PAYS, TLTW, HYGW and LQDW all have a complete 2025 filing year. None of them read Covered. The Covered prints in this aisle sit on stub windows.
The site's `fixed-income` sector tag maps 18 funds, of which 6 read Covered — including MNY (cash management, 96%) and FLI (convertibles, Covered), which are not option overlays. Among the sixteen mapped bond or bond-ETF overlays, five read Covered, and every one of those five is a stub.
Yield and Dist. coverage still run apart
As of the site's latest price date (23 October 2026), approximate distribution yield on the exchange tape — last monthly cheque annualized versus price, labelled tape, not Dist. coverage — reads about 16.6% for TLTW, 9.9% for HBND, 9.8% for HPYT, 5.3% for PAYS and 5.0% for CSHI.
Issuer pages rhyme. Harvest quoted 9.76% current yield on HPYT as at 23 October 2026; Hamilton quoted 10.31% on HBND as at 30 September 2026. Those are rates versus price. They are not earned-versus-paid.
Cash 2026 year-to-date on the same tape reads −3.5% for HPYT, −4.0% for HBND, −0.5% for TLTW, +0.3% for HBIL and +3.8% for CSHI — price change plus cash distributions, not reinvested.
Weak 2025 coverage did not, for the long-duration names, come with a strong 2026 tape path. Coverage still asks a different question from the tape. Neither number is a forecast. A bigger advertised yield is not a higher-quality coverage print — see yield versus coverage.
The ones without a filing yet
Several bond-overlay income funds launched during 2026, so they have no 2025 annual filing to map. On CoverCall Ledger they stay tape-only: FIYY (GraniteShares 20-year Treasuries), LQDM (Amplify LQD 12% target) and HYGM (Amplify HYG 10% target). Price and last distribution can still show from the exchange. Dist. coverage is not inferred from TLTW, from a headline yield, or from a sibling fund.
How to check one yourself
- Open each ticker on the fund directory and read earned versus distributed dollars, not just Covered versus a percentage.
- Confirm the filing-period label before treating two percentages as a race. The Canadian quartet shares calendar 2025. TLTW does not.
- Separate Hamilton's option-write "coverage ratio" from Dist. coverage on this site.
- Treat approximate yield and 2026 cash YTD as tape. They are not the 2025 statements.
- Confirm anything here against the live coverage table and the issuer's MRFP or N-CSR, because both filings and tape move.
The Canadian equity shelf that usually sits next to these tickers in a yield sort is in high yield covered call ETF Canada. Issuer families: Hamilton vs BMO vs Harvest and Global X covered call ETFs.
Educational research from public issuer filings. Not investment, tax or trading advice — confirm every figure against the issuer's own documents before acting on it.