
Searches for "high yield covered call ETF Canada" almost always return a yield leaderboard. This page answers a different question with the same list of funds: across the Canadian-listed option-income ETFs mapped on CoverCall Ledger, which ones did issuer filings actually show earning their distributions for the 2025 filing year — and which did not.
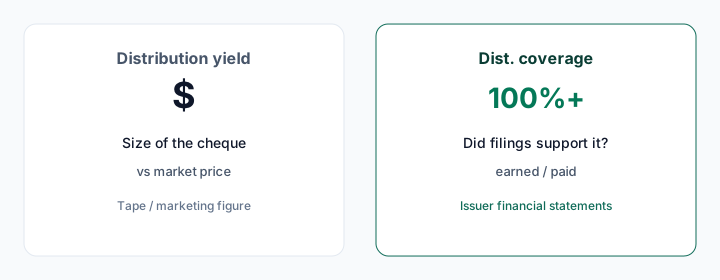
Yield tells you how large the recent cheque was. Dist. coverage tells you whether period profit in the annual financial statements supported it. If you arrived from a yield sort, start here instead.
What "high yield covered call" covers in Canada
The Canadian shelf mixes several designs that get grouped under one search term:
- Classic sector covered calls — ZWB banks, ZWU utilities, ZWC high-dividend
- Yield maximizers — HMAX financials, UMAX utilities, RMAX REITs
- Enhanced (leveraged) covered calls — HDIV, HYLD, QQCL
- High Income Shares and single-name sleeves — HHIS, MSTE
- Bond and cash "premium yield" overlays — HPYT, HBND, HBIL, PAYS
A higher advertised yield usually signals a more aggressive overlay or a more concentrated sleeve. It does not signal better coverage, and the mapped filings show the two are close to unrelated.
The 2025 base rate for Canadian funds
CoverCall Ledger lists 119 Canadian-listed funds. 94 are mapped to a 2025 annual filing or MRFP; the other 25 are tape-only — price and distribution data only, with no coverage percentage, because nothing has been mapped yet. Of the 94 mapped, 76 cover a full 2025 year and 18 cover partial-year "stub" periods.
| Dist. coverage (2025 filing year) | Mapped Canadian funds |
|---|---|
| Covered (100%+) | 63 |
| 50–99% | 16 |
| 1–49% | 7 |
| 0% — filings showed a period loss | 8 |
The median mapped Canadian fund was fully covered, and roughly two-thirds cleared 100%. That is a meaningfully different starting point from the US-listed mapped set on this site, where 17 of 63 cleared 100% and the median sat near 61%.
Read that contrast carefully rather than as a scoreboard. The mapped US set here is heavily weighted toward single-stock option-income funds — 34 YieldMax funds and 17 NEOS funds out of 63 — while the Canadian set is dominated by diversified sector covered calls. The gap says more about which strategies each shelf is full of than about the country.
Where the Canadian shortfalls actually are
This is the part a yield sort hides. The mapped Canadian funds that fell short were mostly not the bank and dividend covered-call funds that the search term usually surfaces.
| Canadian sector (mapped) | Funds | Covered | Median coverage |
|---|---|---|---|
| Financials | 13 | 12 | 100% |
| Canadian equity | 9 | 9 | 100% |
| Commodities | 8 | 8 | 100% |
| Technology | 9 | 8 | 100% |
| Utilities | 5 | 3 | 100% |
| Energy | 4 | 0 | 87% |
| Bond / cash overlays | 6 | 1 | 40% |
| Bitcoin-linked | 4 | 0 | 0% |
The traditional equity covered-call sleeves largely covered their distributions for 2025. The shortfalls concentrated in two pockets: bond and cash yield overlays, and crypto-linked funds.
Bond overlays paid well above period profit
| Ticker | Fund | Dist. coverage | Earned vs paid (2025) |
|---|---|---|---|
| HPYT | Harvest Premium Yield Treasury | 20% | $19.8M vs $98.8M |
| HBND | Hamilton U.S. Bond YIELD MAXIMIZER | 33% | $7.1M vs $21.6M |
| HBIL | Hamilton U.S. T-Bill YIELD MAXIMIZER | 35% | $4.9M vs $13.9M |
| PAYS | Global X Short-Term Gov't Bond Premium Yield | 44% | $2.2M vs $5.1M |
These are among the most eye-catching yields on the Canadian shelf, and they were among the weakest on coverage. HPYT distributed roughly five times its mapped period profit. That does not make it a bad fund — a bond overlay can run a deliberately high, level payout — but it does mean most of the 2025 cheque came from something other than period earnings.
Crypto-linked funds showed period losses
All four mapped Canadian bitcoin-linked funds — HUT, HBTE, BCCC and BCCL — reported a loss for the period, so accrual coverage reads 0%. Distributions continued regardless. MSTE, the concentrated single-name High Income Shares fund, also read 0% against $120.7M distributed. US-listed bitcoin overlays and the crypto-equity cousins are in the bitcoin covered call note.
Filing-backed snapshots
| Ticker | Style | Dist. coverage | Earned vs paid (2025) |
|---|---|---|---|
| ZWB | Bank covered call | Covered | $1.01B vs $207.6M |
| ZWC | High-dividend covered call | Covered | $365.8M vs $112.1M |
| HMAX | Financials yield maximizer | Covered | $385.4M vs $198.1M |
| HDIV | Enhanced Canadian covered call | Covered | $247.0M vs $91.1M |
| ZWU | Utilities covered call | Covered | $226.4M vs $140.8M |
| QQCL | Enhanced Nasdaq-100 covered call | Covered | $41.2M vs $34.8M |
| HHIS | Diversified high income shares | 88% | $133.2M vs $150.9M |
| UMAX | Utilities yield maximizer | 63% | $72.7M vs $116.3M |
| RMAX | REITs yield maximizer | 41% | $4.0M vs $9.9M |
| MSTE | Single-name enhanced HIS | 0% | Loss vs $120.7M paid |
Same "high income" aisle, very different filing outcomes.
A better workflow than yield sorting
1. Filter the live coverage table to Canada rather than sorting the whole universe by yield.
2. Sort by Dist. coverage, then read earned vs paid on the fund page — the dollar gap matters more than the percentage.
3. Check the period label: a 2025 stub year is not a full year, and tape-only means no filing is mapped.
4. Note which design you are looking at. Bond overlay, enhanced equity, and single-name sleeves behave very differently.
5. Confirm every figure against the issuer's MRFP or annual financial statements.
Browse the A–Z fund directory, then read HMAX vs ZWB vs HDIV and Hamilton vs BMO vs Harvest for the issuer-level picture. For the labels themselves, see How to read Dist. coverage. For the US names that dominate English-language "high yield" talk, see JEPI vs JEPQ vs QYLD and YieldMax / single-stock option income.
Bottom line
"High yield covered call ETF Canada" is a product-category search, and the category is not uniform. For 2025, the mapped Canadian equity covered-call funds mostly earned their distributions; the mapped bond overlays and crypto-linked funds mostly did not. Coverage is a backward-looking fact for one stated period, not a forecast — and this is educational research from public filings, not investment advice.