
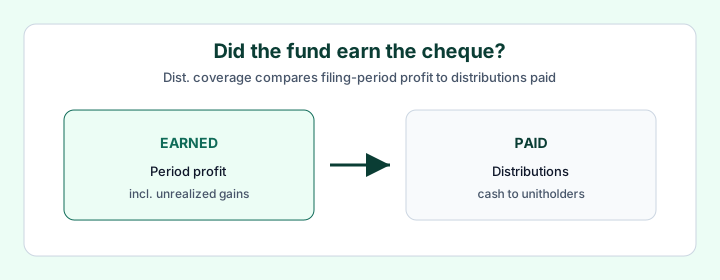
Distribution coverage answers one question: for a stated filing year, did the fund’s accounting earnings support what it paid unitholders? It is not the same as yield, which only describes the size of recent cheques relative to price.
CoverCall Ledger maps Dist. coverage from public issuer financial statements (MRFP / annual FS / N-CSR). When a year is not mapped yet, the table stays honest: tape only, not invented coverage.
Yield vs Dist. coverage
| Question | Measure | Source |
|---|---|---|
| How large is the cheque vs price? | Distribution yield | Price + recent distributions |
| Did period profit support what was paid? | Dist. coverage | Issuer financial statements |
Two funds can show similar yields and very different coverage once you read the filings.
How CoverCall Ledger scores it
We compare earned (period profit from the statements, including unrealized gains while holdings are still owned) with distributed (cash paid to unitholders) for a stated year.
- At 100% or above, the table shows Covered
- Below that, you see the percentage
- If statements for that year are not published or not yet mapped, Dist. coverage reads not published yet / tape-only
This is accrual coverage. It matches how issuers report period profit. It is not a forecast, not tax advice, and not a buy/sell rating.
Mapped examples (2025 filing year)
Open each fund page for earned vs paid and the source filing link where available:
- HHIS — 88% covered (earned $133.2 million vs paid $150.9 million)
- HMAX — Covered (earned $385.4 million vs paid $198.1 million)
- ZWB — Covered (earned $1.01 billion vs paid $207.6 million)
- JEPI — 96% covered (earned $2.92 billion vs paid $3.03 billion)
- MSTE — 0% covered (operations loss vs paid $120.7 million)
Figures are filing-backed snapshots for the mapped period. Always confirm against the issuer’s documents.
Filing-period return vs CoverCall 2026 YTD
Filing-period total return is the issuer’s unit return for that statement year (often with distributions reinvested on NAV). Cash YTD and Reinv. YTD on CoverCall Ledger are exchange-tape estimates from the Dec 31, 2025 close through the latest print. Different windows and methods — do not mix them up.
Next steps
1. Walk the labels on How to read Dist. coverage
2. Compare yield vs coverage in Distribution coverage vs yield
3. Sort the live coverage table or browse fund pages A–Z