
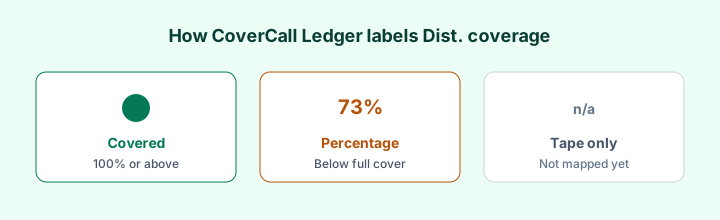
If you are weighing an "Enhanced" covered-call ETF against its plain sibling — QQCL against QQCC, HHLE against HHL — the worry underneath is usually that the borrowed money makes the distribution less sustainable. This page answers the narrow, checkable version of that question: across Canadian pairs where the only structural difference is roughly 25% leverage, what did the mapped 2025 filings show for period profit versus distributions paid?
That is Dist. coverage — accrual earned vs paid from issuer financial statements. It is not a yield comparison, not a risk rating, and not a view on whether either version of a fund belongs in a portfolio.
"Enhanced" is not a standardised structure
Before comparing anything, check what the word means on the fund in front of you.
At Global X Canada the "…L" tickers are alternative mutual funds under NI 81-102 that hold the standard sibling ETF and borrow cash to maintain a leverage ratio of about 125%. The issuer describes QQCL as 125% exposure to QQCC, and BKCL holds BKCC on the same basis.
Harvest uses the word the same way. HHLE invests on a levered basis in HHL, HUTE in HUTL, each targeting borrowing of about 25% of net asset value. Hamilton's HDIV and HYLD also run roughly 25% cash leverage, though across a basket of covered-call ETFs rather than one sibling fund.
Elsewhere the label means something else. Evolve's "Enhanced Yield" range is mixed — some of those funds add about 25% leverage, while others are simply covered-call funds with no borrowing at all. Defiance's "Enhanced Options & 0DTE Income" funds are not a leverage story either.
So "Enhanced" is a marketing word wrapped around several different structures. Everything below uses only pairs where the leverage relationship is spelled out in the issuer's own documents.
Why these pairs are a clean test
Fifteen pairs on CoverCall Ledger have an enhanced and a standard version of the same underlying exposure, from the same issuer, both mapped to the same 2025 filing-period label.
That is about as controlled as retail fund data gets: the index, the option-writing programme and the manager are held constant, and the borrowing is the variable.
One reading note before the tables. The enhanced fund is a separate fund with its own asset base, so the dollar totals reflect each fund's size rather than the 1.25x ratio. Only the percentage is comparable across a pair.
Global X Canada: nine pairs
| Underlying exposure | Enhanced | Standard |
|---|---|---|
| Nasdaq-100 | QQCL Covered — $41.2M vs $34.8M | QQCC Covered — $63.9M vs $49.6M |
| S&P 500 | USCL 98% — $32.3M vs $32.9M | USCC Covered — $54.1M vs $37.0M |
| Canadian banks, equal weight | BKCL Covered — $41.8M vs $19.1M | BKCC Covered — $63.7M vs $28.3M |
| S&P/TSX 60 | CNCL Covered — $3.6M vs $1.6M | CNCC Covered — $21.0M vs $9.1M |
| Canadian oil & gas | ENCL 93% — $35.3M vs $37.9M | ENCC 94% — $71.0M vs $75.2M |
| All-equity asset allocation | EQCL Covered — $7.0M vs $4.9M | EQCC Covered — $1.5M vs $0.9M |
| MSCI EAFE | EACL Covered — $0.6M vs $0.3M | EACC Covered — $5.1M vs $2.6M |
| MSCI emerging markets | EMCL Covered — $0.5M vs $0.3M | EMCC Covered — $2.3M vs $1.3M |
| Canadian telecom (2025 stub) | RNCL 90% — $0.4M vs $0.4M | RNCC 93% — $0.5M vs $0.5M |
Harvest: six pairs
| Underlying exposure | Enhanced | Standard |
|---|---|---|
| Healthcare leaders | HHLE Covered — $8.0M vs $7.8M | HHL Covered — $171.6M vs $154.3M |
| Global utilities | HUTE Covered — $6.8M vs $4.8M | HUTL Covered — $45.3M vs $26.7M |
| NVIDIA | NVHE Covered — $52.8M vs $32.2M | NVDH Covered — $7.9M vs $4.9M |
| Eli Lilly | LLHE Covered — $59.5M vs $24.0M | LLYH Covered — $7.2M vs $3.6M |
| Amazon | AMHE 66% — $5.7M vs $8.6M | AMZH 50% — $1.2M vs $2.4M |
| Microsoft | MSHE 37% — $3.8M vs $10.4M | MSFH 32% — $861K vs $2.7M |
What fifteen pairs showed
Ten pairs read Covered on both sides. Three showed the enhanced fund one to three points lower than its sibling. Two showed the enhanced fund higher than the unlevered version.
Not one pair showed the levered fund collapsing while the standard one held up. On the accrual lens, for these mapped 2025 periods, roughly 25% borrowing did not systematically break coverage.
The mechanical reason is that leverage scales both sides of the ratio. Borrowing 25% buys 25% more of the same portfolio, so period profit rises roughly in proportion — and the enhanced fund's distribution is deliberately set higher to match. Earned and paid move together, so the ratio moves far less than the yield does. That is the same point the yield versus coverage guide makes from the other direction: a bigger cheque is not by itself a worse-covered cheque.
Where the gaps actually came from
The two pairs that moved most were single-name Harvest funds, and both moved in the direction most people would not predict.
AMHE covered 66% of what it distributed while the unlevered AMZH covered 50%. MSHE covered 37% against MSFH at 32%.
Both Harvest versions write calls on up to 50% of the portfolio, and the issuer states that the write level is set with reference to the fund's distribution policy. So the spread between an enhanced and a standard sibling is largely an option-writing and distribution-policy decision, not an artefact of the borrowing.
The clearest case in the other direction is USCL, which came in at 98% — $32.3 million earned against $32.9 million distributed, a shortfall of roughly $600,000 — while USCC read Covered. Leverage did not cause a blow-up there. It coincided with a near-miss on a line the table draws at exactly 100%.
"Covered" is a floor, not a score
Ten of the fifteen pairs are recorded as ties, and that is partly an artefact of how the column works.
Dist. coverage stops at Covered. Once a fund clears 100% the table does not keep counting, so two funds with very different cushions read identically.
The published dollars still show the difference. QQCL earned $41.2 million against $34.8 million paid, roughly 1.2x. QQCC earned $63.9 million against $49.6 million, roughly 1.3x. Both read Covered, but the unlevered sibling carried the wider proportional margin.
If the size of the cushion matters to you rather than the pass-or-fail badge, read the earned and distributed figures on each fund page, the way the how to read Dist. coverage walkthrough describes.
What this does not tell you
Coverage is not a risk measure. Borrowing amplifies drawdowns, adds interest expense that moves with rates, and puts a fund in the alternative mutual fund category with a different risk profile. None of that appears in an earned-versus-paid ratio for a completed filing year.
Two of the pairs above, RNCL and RNCC, are mapped to a partial 2025 window labelled `2025 stub`. Earned and paid are measured over the same window, so the percentage is internally consistent, but it is not a full year and not an annualised run rate.
Every pair here is also Canadian-listed, which is where the enhanced-versus-standard structure is common. The broader Canadian picture sits in the high-yield covered call ETF Canada note, and the issuer families behind these funds are compared in Hamilton vs BMO vs Harvest.
Finally, one filing year says nothing about the next. Check the current figures on the live coverage table rather than trusting a number in an article.
How to check a pair yourself
- Find both tickers in the fund directory and open the two pages side by side.
- Compare the Dist. coverage percentage first, then the earned and distributed figures behind it.
- Confirm both funds carry the same filing period before reading anything into a difference.
- Read the enhanced fund's ETF Facts to see what "Enhanced" actually means there — cash borrowing, a larger option write, or only a name.
- Treat any fund without a mapped filing as tape-only: price and last distribution are real, but coverage is not invented from them.