
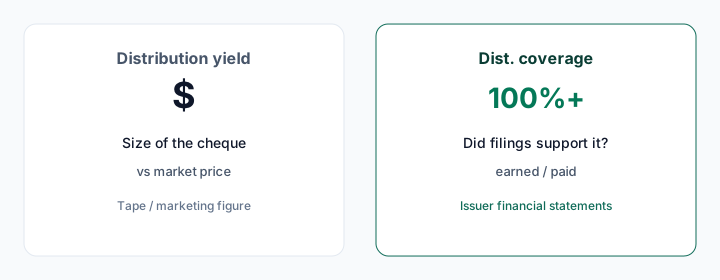
Searches for a bitcoin covered call ETF or bitcoin income ETF almost always surface a distribution rate. This page answers a different question with the same tickers: across every bitcoin-price overlay fund CoverCall Ledger has mapped to a 2025 issuer filing, did period profit cover what was paid out?
That is Dist. coverage — accrual earned versus paid, read from annual financial statements. It is not a yield ranking, not a tax opinion, and not a view on whether bitcoin belongs in a portfolio.
Bitcoin pays no dividend, so the cheque is the overlay
A covered-call fund on a stock index still collects ordinary dividends. A bitcoin overlay does not. The cash sent to unitholders is almost entirely option premium, plus whatever the manager chooses to pay from capital.
If the overlay and the bitcoin path produced a period profit, coverage can still print Covered. If they produced a loss, coverage reads 0% — no period profit to set against the cheque. Zero is a period-loss label, not a tax characterization and not a claim that cash was never paid.
The 2026 conversation around these products is mostly about return of capital on individual distributions. Roundhill's Rule 19a-1 notice for the YBTC payment payable 8 October 2026 estimated 100% of that distribution as ROC, and NEOS notices through 2026 have estimated a similarly large share on BTCI. Those are preliminary tax-character estimates for a single payment. Dist. coverage is an economic statement about a completed filing year. They can disagree in both directions — see ROC vs earned the cheque.
Ten bitcoin overlays, none Covered
CoverCall Ledger maps a 2025 filing for ten ETFs whose option programme is written against bitcoin or a bitcoin ETP, rather than against a stock index or a single equity. None of them read Covered.
For scale: 153 of 329 mapped funds on the site cleared 100% for their filing year, about 46%. Narrow it to US-listed funds and 42 of 157 mapped funds read Covered. Zero of ten is well below either base rate.
| Fund | Listing | Filing period | Earned | Distributed | Dist. coverage |
|---|---|---|---|---|---|
| BITY | US | 2025 stub FY Sep | $703 thousand | $1.1 million | 65% |
| BAGY | US | 2025 stub FY Sep | $508 thousand | $1.2 million | 44% |
| YBIT | US | 2025 FY Oct | $26.2 million | $77.8 million | 34% |
| BTCI | US | 2025 stub | Loss of $160.1 million | $110.0 million | 0% |
| YBTC | US | 2025 | Loss of $25.5 million | $110.9 million | 0% |
| BTCY | CA | 2025 | Loss of $6.9 million | $27.4 million | 0% |
| HUT | CA | 2025 stub | Loss of $12.1 million | $5.5 million | 0% |
| DFII | US | 2025 stub | Loss of $3.9 million | $1.3 million | 0% |
| BCCC | CA | 2025 stub | Loss of $1.6 million | $1.5 million | 0% |
| BCCL | CA | 2025 stub | Loss of $0.9 million | $1.1 million | 0% |
Seven of the ten reported a period loss, so coverage is 0% by construction. The other three — Amplify's BITY and BAGY, and YieldMax's YBIT — recorded period profit and still paid out more than they earned. YBIT is the largest of those three: $26.2 million earned against $77.8 million distributed for the fiscal year ended October 2025.
The two scale names sit at the other end. BTCI reported a loss of $160.1 million while distributing $110.0 million on its mapped stub window. YBTC reported a loss of $25.5 million while distributing $110.9 million for calendar 2025. Those are different fiscal windows — two separate filings that rhyme, not one combined year.
Crypto-equity is a different book
The site's bitcoin sector tag also includes funds that hold crypto-industry stocks rather than bitcoin itself. Those are not the same overlay, and the filings show it.
| Fund | What it holds | Filing period | Dist. coverage | Earned vs paid |
|---|---|---|---|---|
| BLOX | Crypto-industry equities plus bitcoin/ether ETFs | 2025 stub FY Oct | Covered | $15.4M vs $8.5M |
| CEPI | Crypto equity premium income | 2025 stub FY Oct | 84% | $13.6M vs $16.3M |
| HBTE | Bitcoin-ecosystem stocks, ~25% leverage | 2025 stub | 0% | Loss of $0.4M vs $8.1M paid |
BLOX is the only fund tagged bitcoin on this site that cleared 100%, and it is not a bitcoin-price overlay: the issuer describes crypto-industry equities plus bitcoin and ether ETFs, with options written on the holdings. CEPI sits in the same neighbourhood. HBTE is Harvest's bitcoin-leaders sleeve — stocks, not the coin — and still printed a period loss on its stub year.
Single-stock option-income on Coinbase is a third design. CONY read 25% for FY Oct 2025 ($291.5 million earned vs $1,178.0 million paid). That belongs with the YieldMax lineup, not with a bitcoin ETP overlay.
Ether followed the same filing year
YETH read 0% for calendar 2025 (loss of $27.4 million vs $45.8 million paid). ETHY, Purpose's Canada-listed ether yield fund, also read 0% (loss of $3.6 million vs $11.3 million). NEHI, the NEOS ether sleeve, read 25% on a stub window — $0.06 million earned against $0.25 million paid, a percentage that moves on a very small dollar base. None of those three cleared 100%.
Read the period labels before reading the ranking
These funds are not mapped to the same window. YBTC, BTCY, YETH and ETHY sit in calendar 2025. YBIT is a fiscal year ended October. BITY and BAGY are stub periods on a September year-end. Most of the Canadian bitcoin products, plus BTCI and DFII, are labelled `2025 stub` — a partial first year rather than twelve months.
A stub is internally consistent — earned and paid cover the same window — but it is not comparable to a full year and is not an annualised run rate. Several stub funds also rest on small dollar bases, so a few hundred thousand dollars either way moves the percentage. Confirm the period on the fund page before comparing two tickers.
Coverage is not 2026 performance
As of the site's latest price date (9 October 2026), cash 2026 year-to-date on the exchange tape reads −9.1% for BTCI, −13.9% for YBTC, −13.5% for BTCY, −11.6% for YBIT, −16.1% for BITY and −18.1% for BAGY. Those are tape figures — price change plus cash distributions, not reinvested — for a different period from the filings.
The crypto-equity names diverged. HBTE shows +12.1% cash YTD on the same tape despite 0% mapped 2025 coverage, and CEPI shows +20.7%. Coverage asks whether 2025 statements supported the cheque; the tape reports a later price path. Neither number is a forecast.
Issuer pages still advertise distribution rates in the high teens and twenties. Yield is cheque size versus price. It does not tell you whether the last filing year earned that cheque — see yield versus coverage.
The ones without a filing yet
Several bitcoin and ether income funds launched during 2026, so they have no 2025 annual filing to map. On CoverCall Ledger they stay tape-only: BDAY (Hamilton), XBCI (NEOS Boosted), BITA (iShares) and EHCC (Global X ether). Price and last distribution can still show from the exchange. Dist. coverage is not inferred from a sibling fund, a headline yield, or a 19a-1 notice — see how to read Dist. coverage.
How to check one yourself
- Open the ticker in the fund directory and read the earned and distributed dollars, not just the percentage.
- Check the filing period label first. A stub year and a full year are not comparable, and 0% means a period loss.
- Separate bitcoin-price overlays from crypto-equity funds before comparing coverage.
- Read the issuer's 19a-1 notices or Canadian tax character notes for ROC — and treat that as a separate question from coverage.
- Confirm anything here against the live coverage table, because filings and tape both move.
Educational research from public issuer filings. Not investment, tax or trading advice — confirm every figure against the issuer's own documents before acting on it.